Skip to content

Work/Grand Rounds

02 · Grand Rounds · Healthcare · 2018–2019

A valued benefit that members struggled to use

Grand Rounds sold a valued benefit to employers, but members struggled to use it. The CEO asked for an experience members would choose.

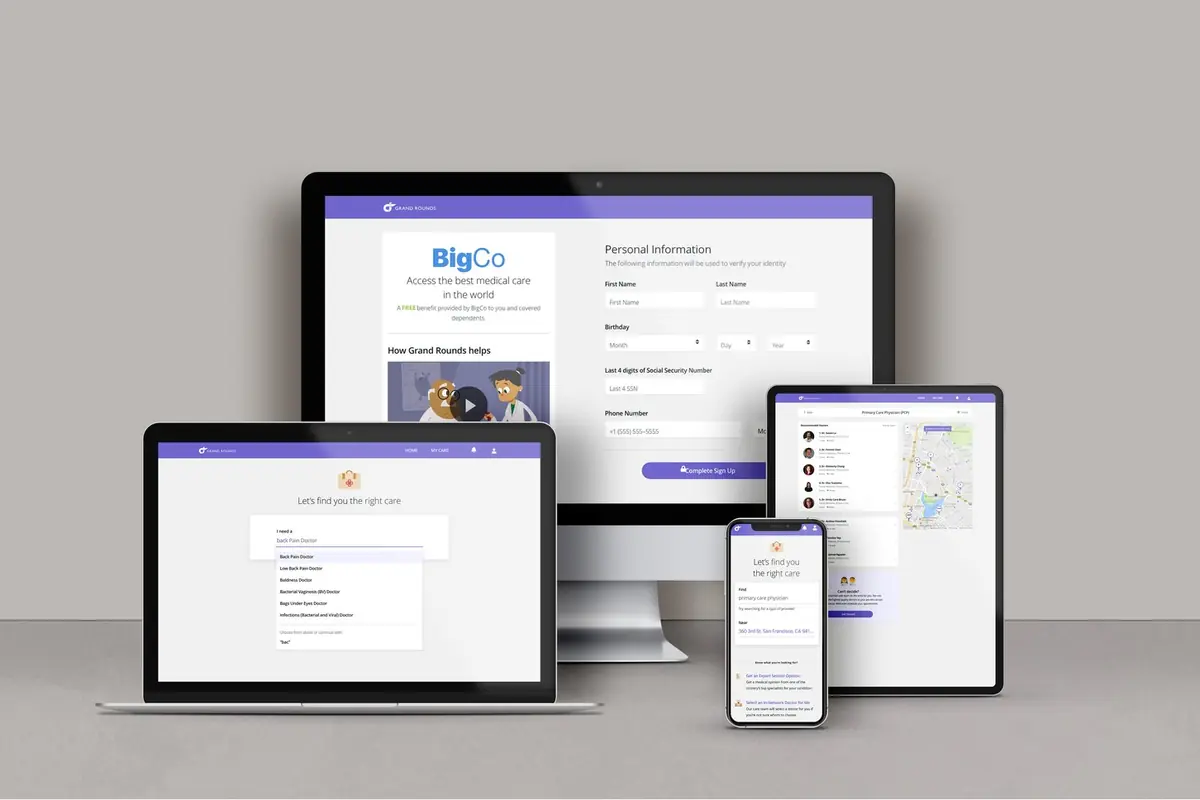
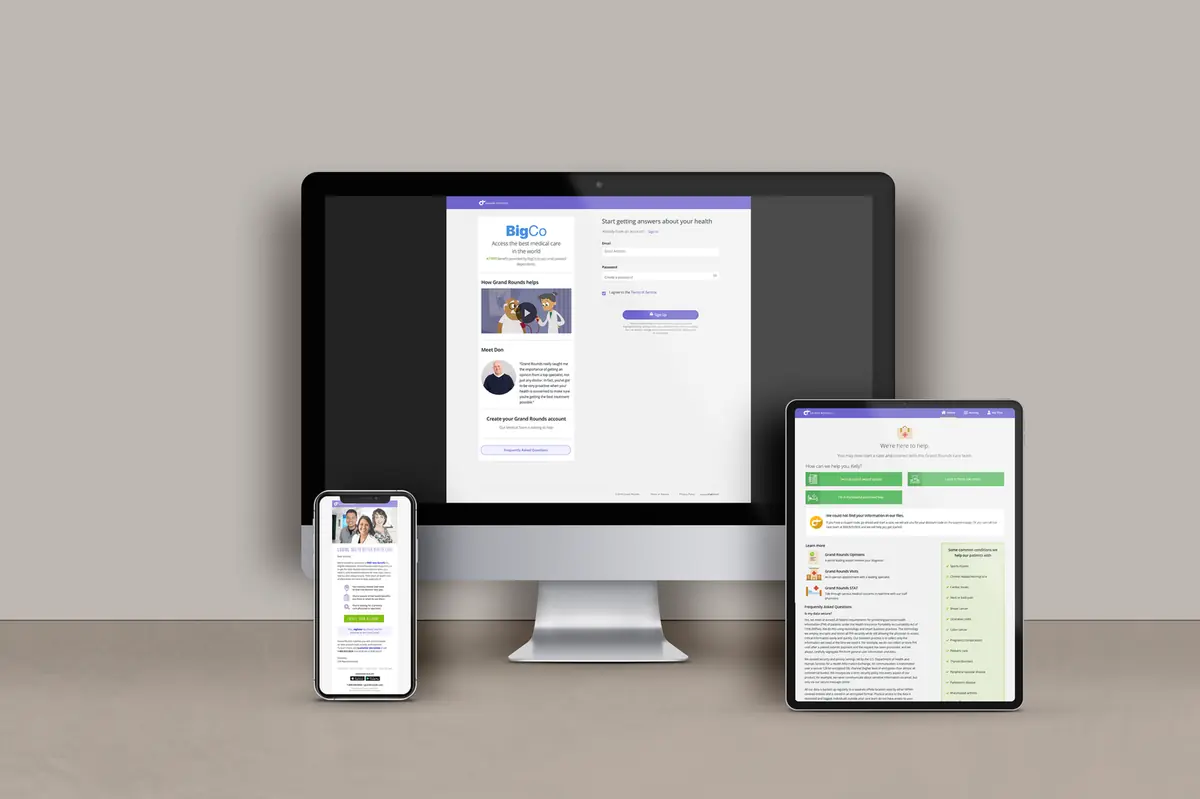
The Grand Rounds member experience on desktop, laptop, tablet, and phone
The problem
Activation sat at 45%, only 40% of members were satisfied, and NPS was 25 online against 87 by phone.
What we did
We paused new market-facing features, designed a service vision around members with chronic conditions, and tested it in seven Design Sprints.
Results
+15% sign-up conversion and +51% new service starts in a six-week onboarding pilot. Separately, customizable sales demos built from the final prototype generated $58M in sales pipeline.
Role
Head of Product Design & User Research (Senior Director), 2018–2019
Owned
Member experience direction and the research agenda
Team
17 in design and research
Partners
Product, engineering, clinical, and analytics leaders
Regulated delivery: member web, mobile, and Care Center tooling in a HIPAA, SOC 2, and HITRUST environment.

The mandate

Redesign the member experience, company-wide

I was asked to lead the company-wide redesign of the member experience. This is where it started.

45%
activation
40%
members satisfied (CSAT)
25 vs 87
NPS: 25 online, 87 by phone

The diagnosis

Research on chronic members changed the plan

The insight

Complex and chronic members were the most in need, and the most likely to use the service.

The decision

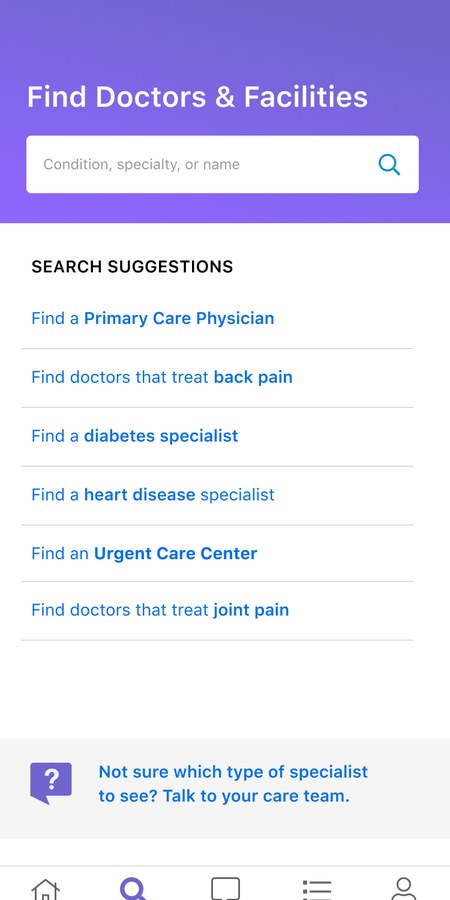
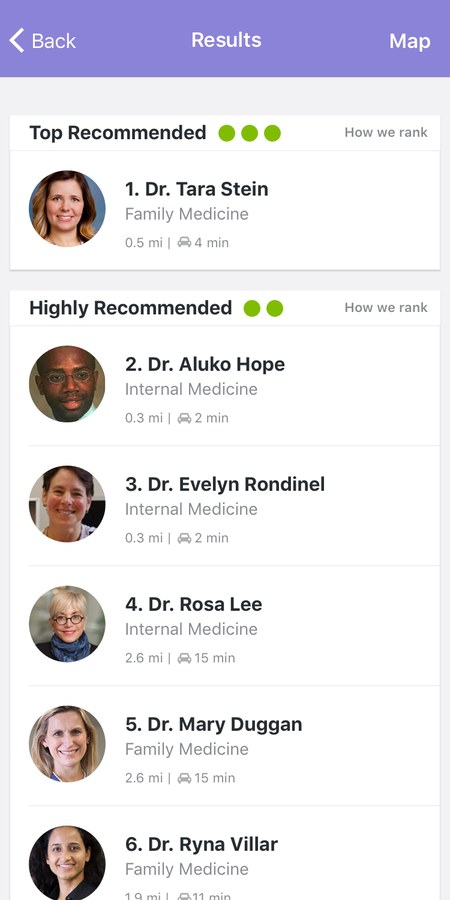
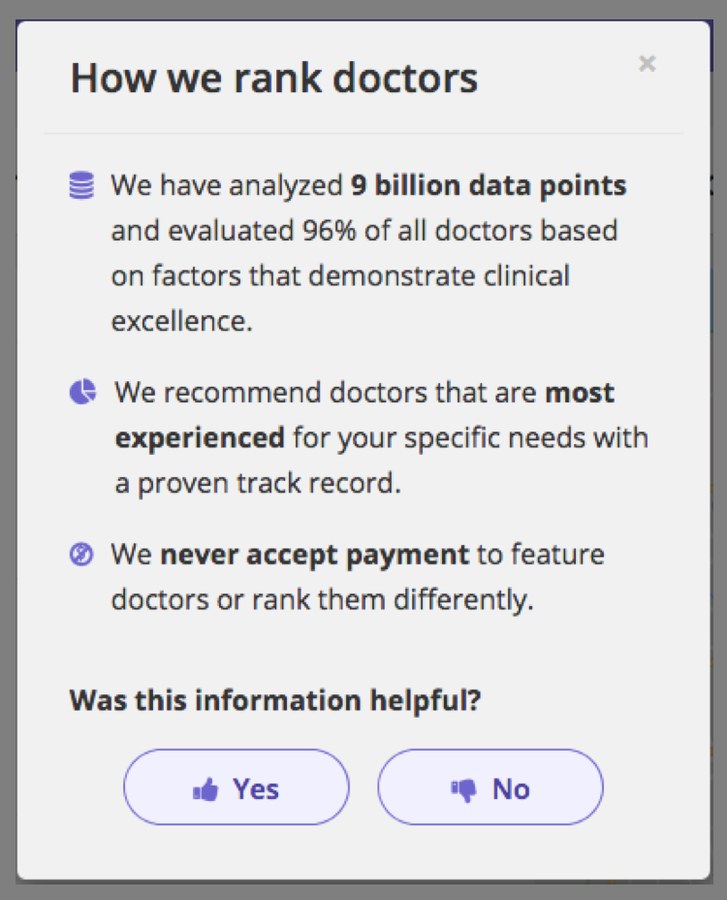
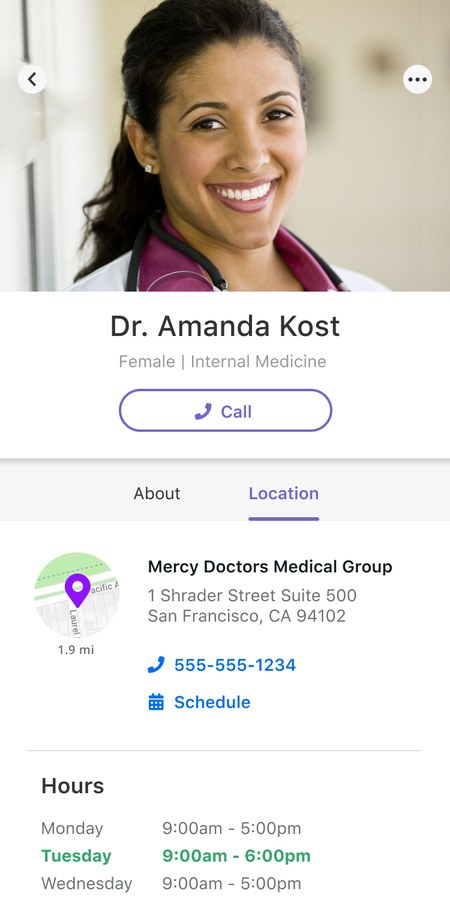
We paused new market-facing features and built a service vision we could test, starting with chronic members. It covered navigation, financial guidance, and care support.

Tradeoff

New market-facing features paused for a 14-week sprint program.

What we tested

Guided vs. comprehensive onboarding, conversation vs. forms, and editorial guidance vs. quick links.

Research input: 4 primary studies, 11 external sources, 8 domain experts.

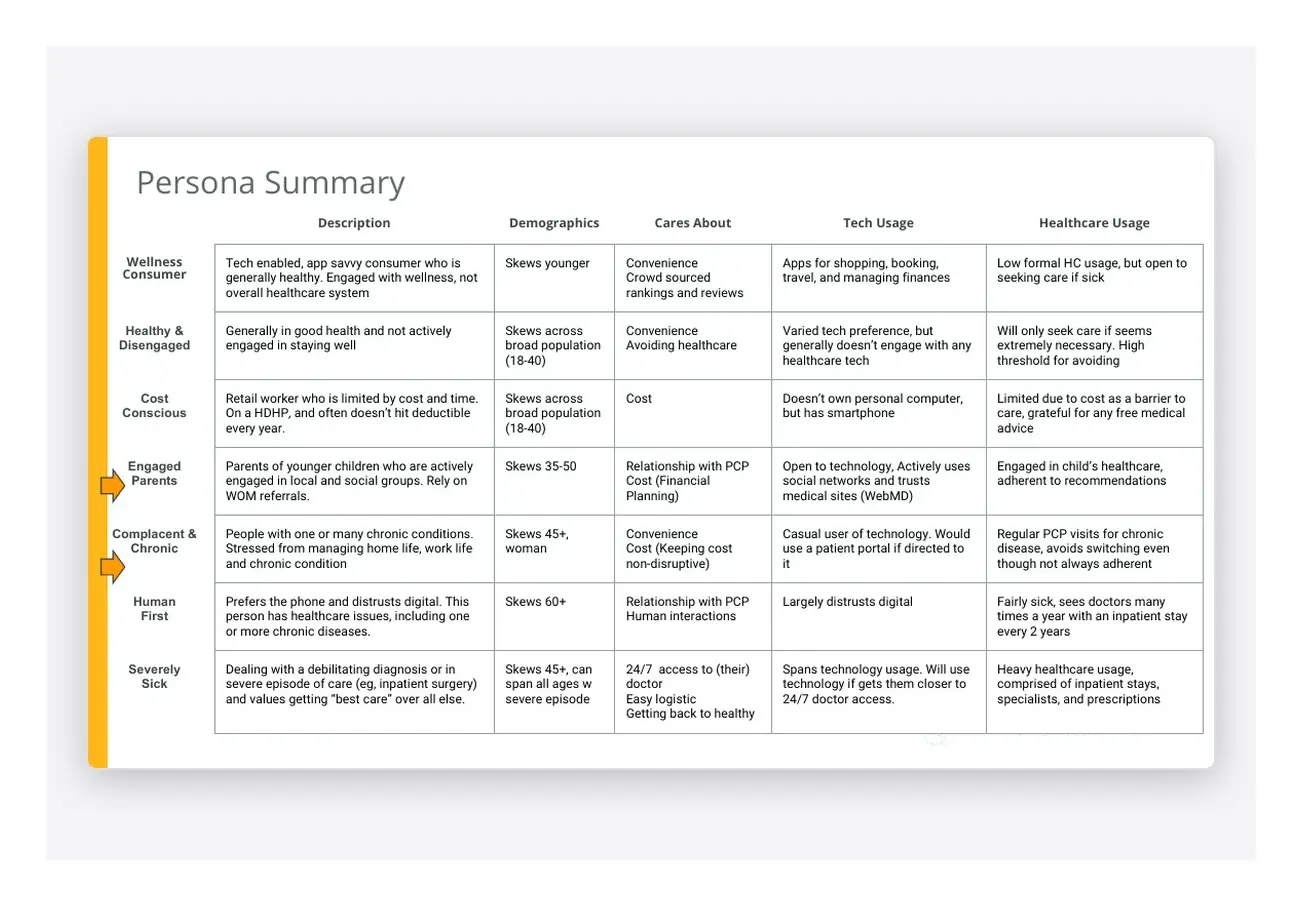
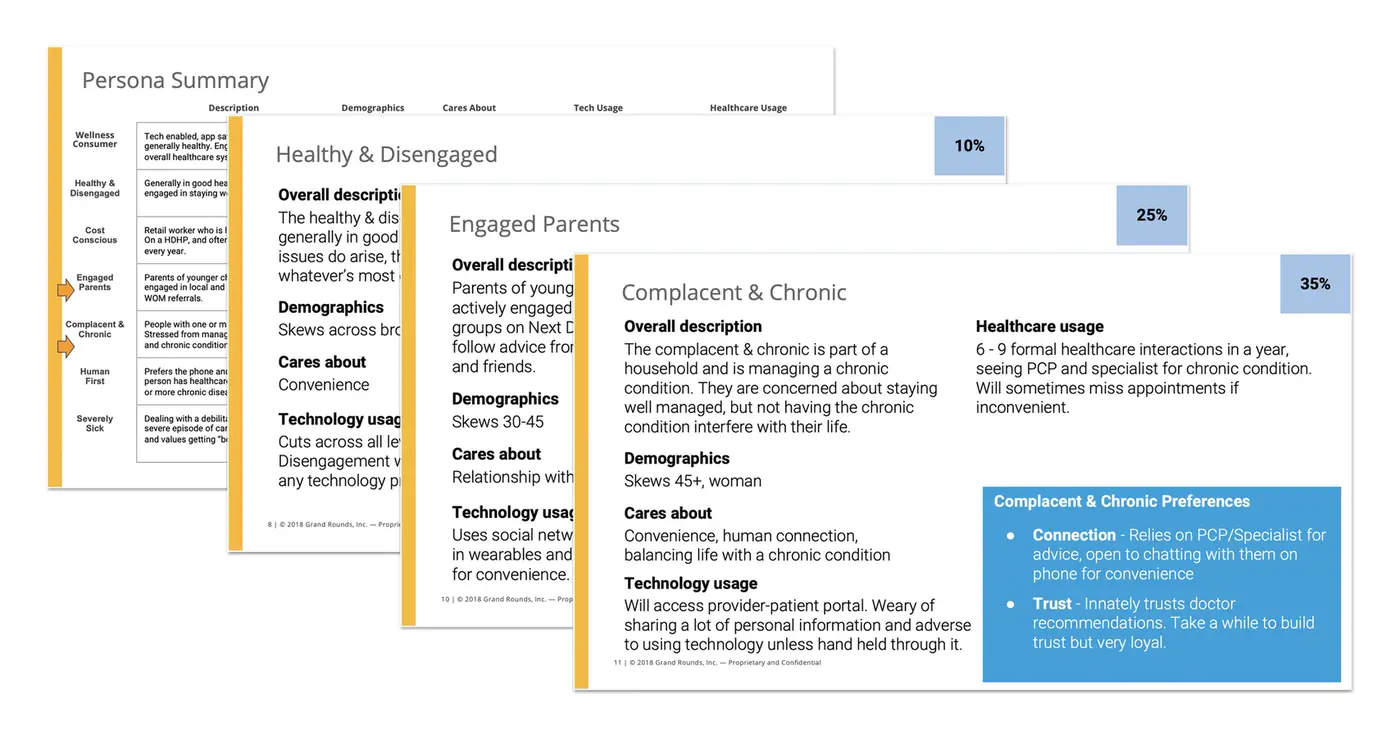
Persona summaries from the research, including complex and chronic members
Persona summaries from the research.

The reset

We had started down an incremental backlog. My Director of Product and I agreed it would not close the gap, so we stopped the work and reset it around three member needs: find the right care, understand cost and benefits, and get help navigating care.

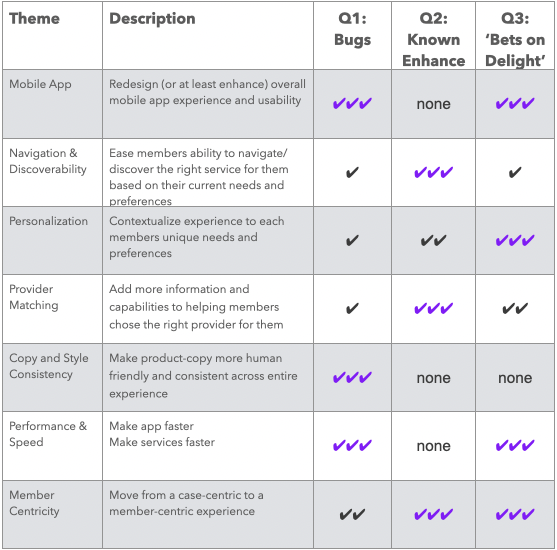
The incremental plan: seven themes scheduled across three quarters, from bug fixes to known enhancements to bets on delight
The incremental plan we set aside: bugs, then known enhancements, then “bets on delight.”

Leadership and delivery

Cross-functional sprint teams made the vision real

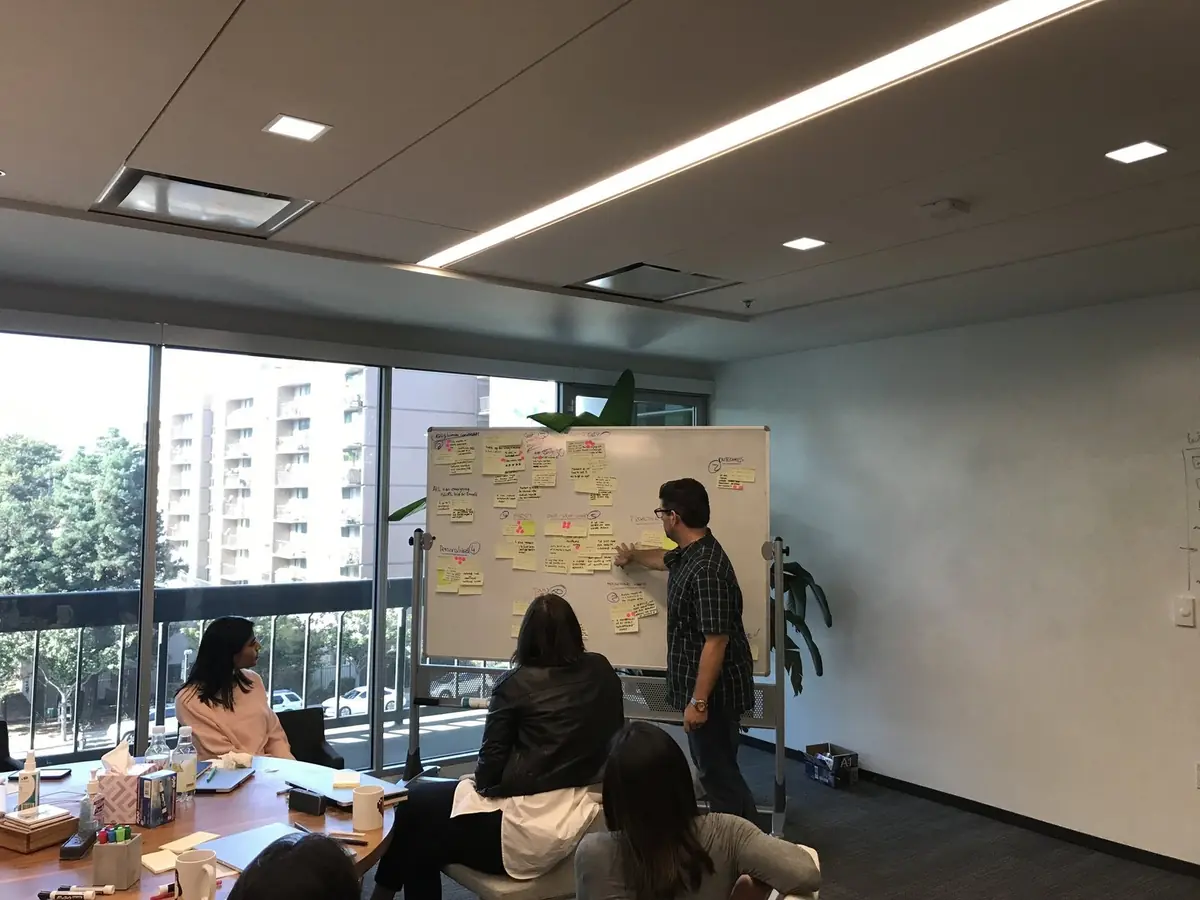
A sprint workshop with the cross-functional team
Sprint workshop
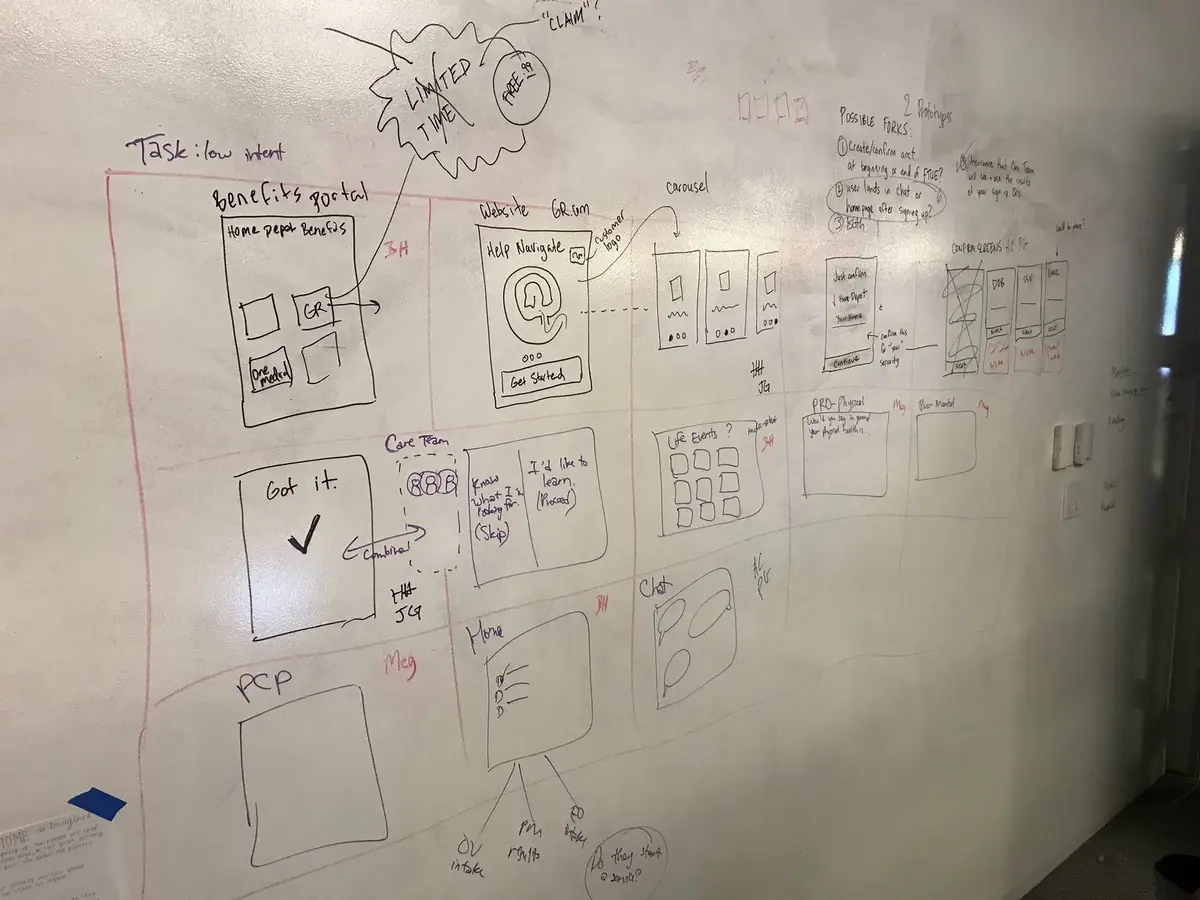
A whiteboard storyboard from a design sprint
Sprint storyboard
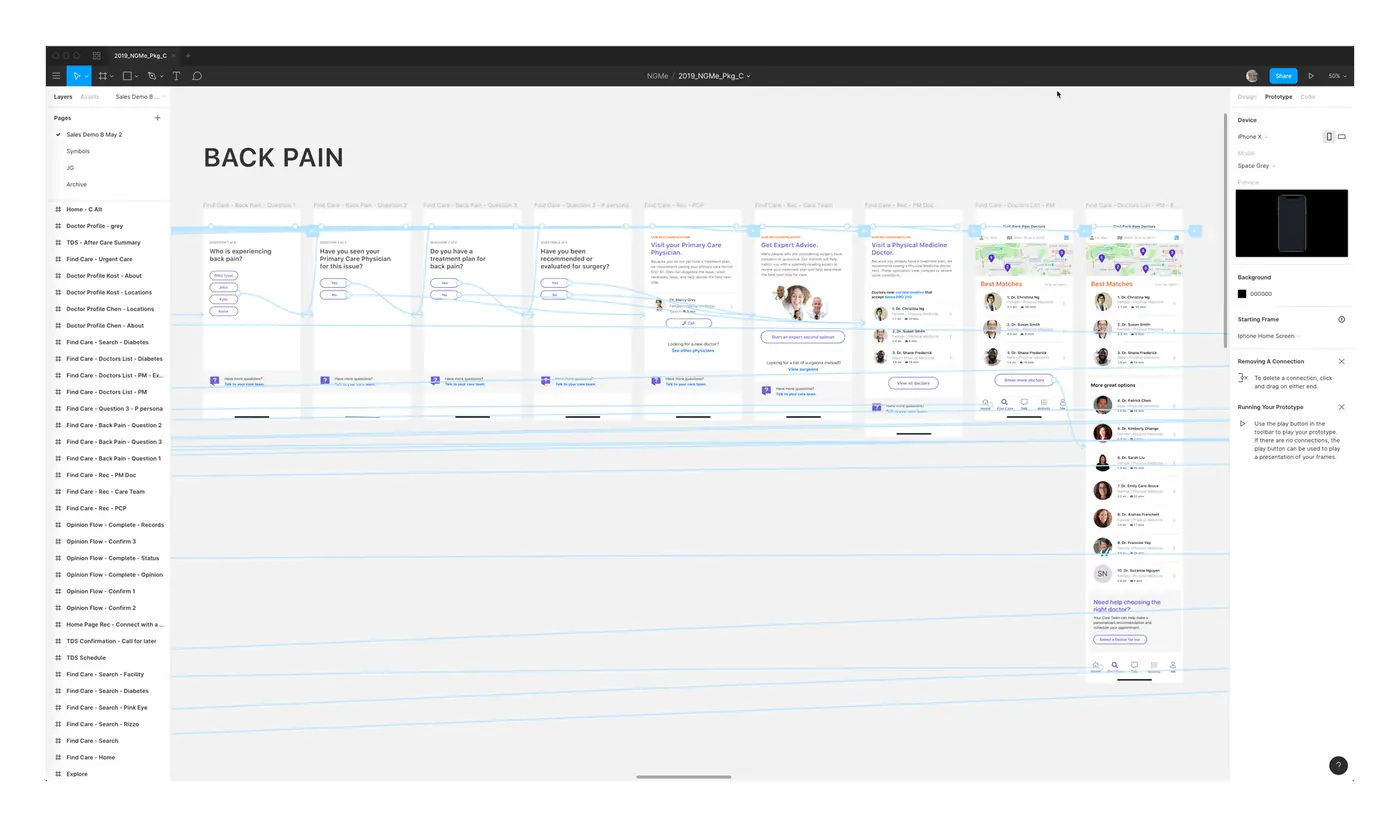
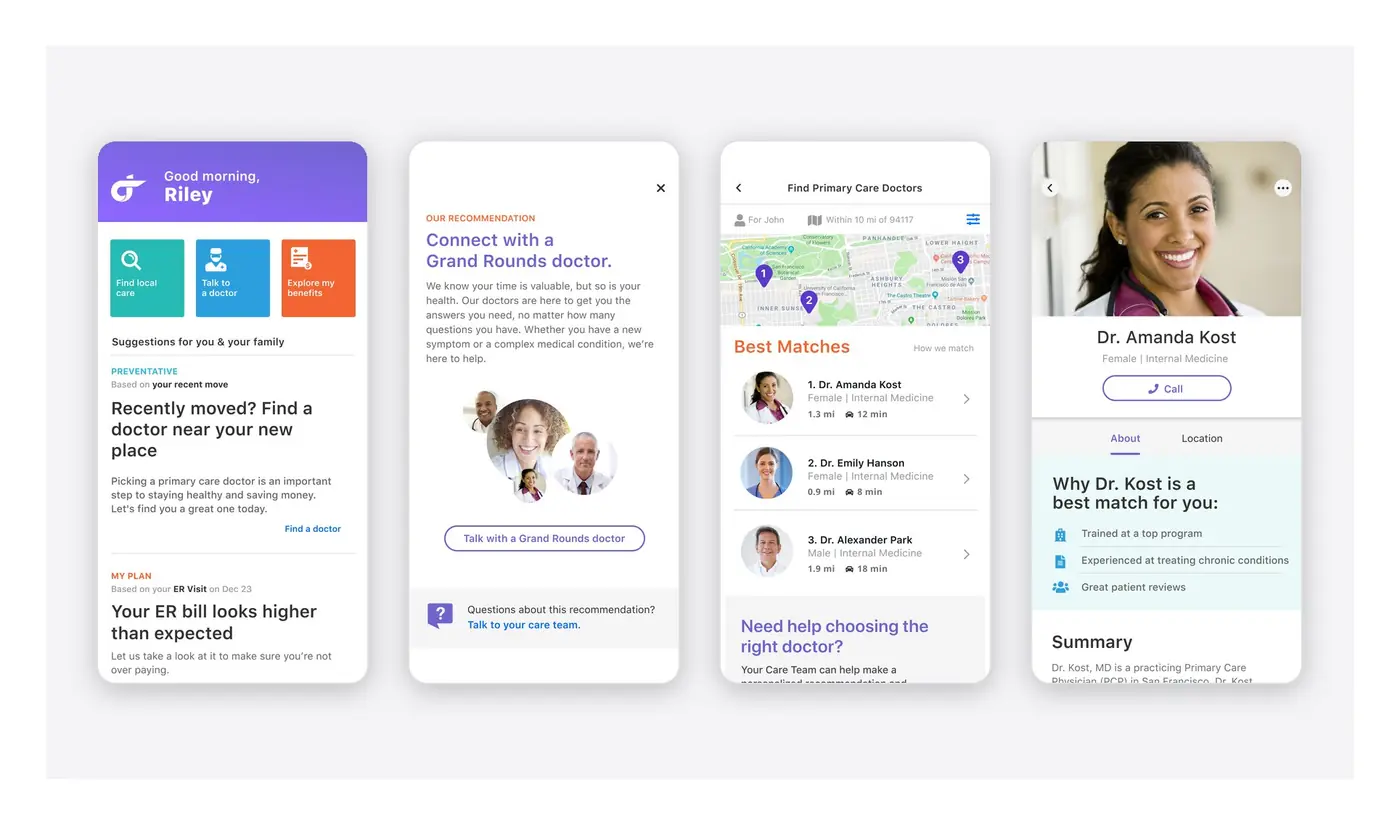
Mobile prototype screens tested in usability sessions
Prototype
7 Design Sprints
over 14 weeks, in 3 phases
8–10
core team, with 26 contributors from analytics, clinical nursing, and product marketing
14
prototypes, 50 sessions, 3 projects to production
90%
task success in validation
47 / 50
preferred the new app

How the work connected

From research to releases

Research shaped the service vision, and the design sprints tested it. From the vision, the work went two ways: releases to production and demos for sales.

  1. Research
    Who needs us most

    4 primary studies, 11 external sources, and 8 domain experts pointed to complex and chronic members.

  2. Service vision
    Three member needs

    Find the right care, understand cost and benefits, and get help navigating care.

  3. Design sprints
    Mobile prototypes

    7 sprints, 14 prototypes, 50 sessions. 90% task success; 47 of 50 preferred the new app. Members skipped explanations they hadn’t asked for, so onboarding had to show its value in context.

From the vision, the work went two ways

Production
Three releases

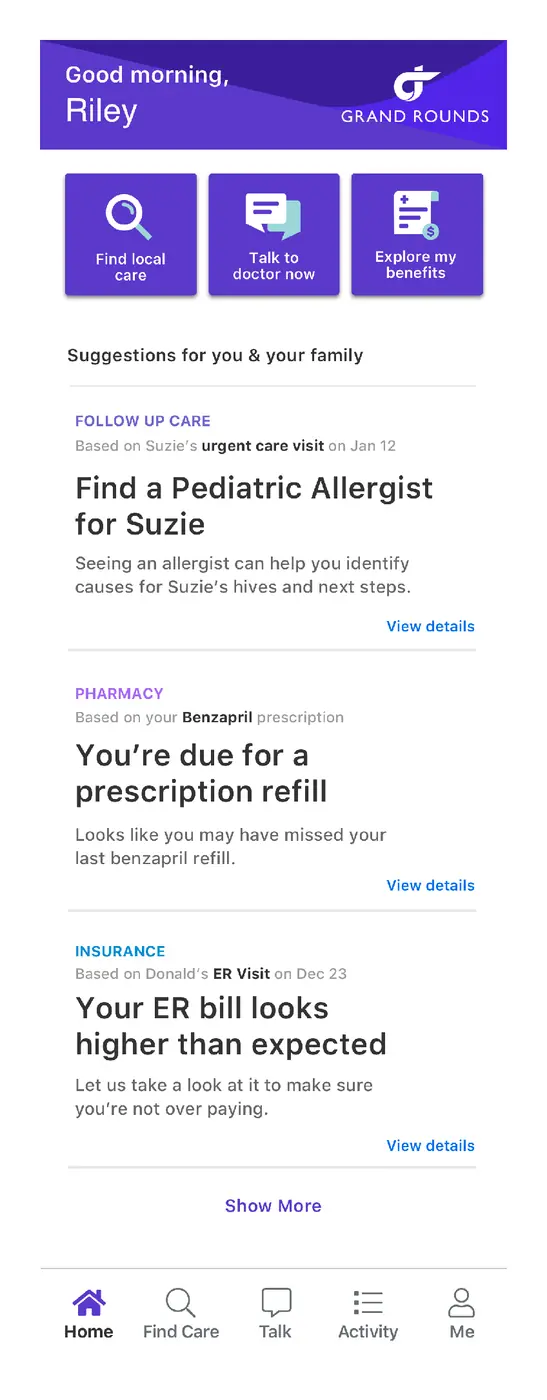
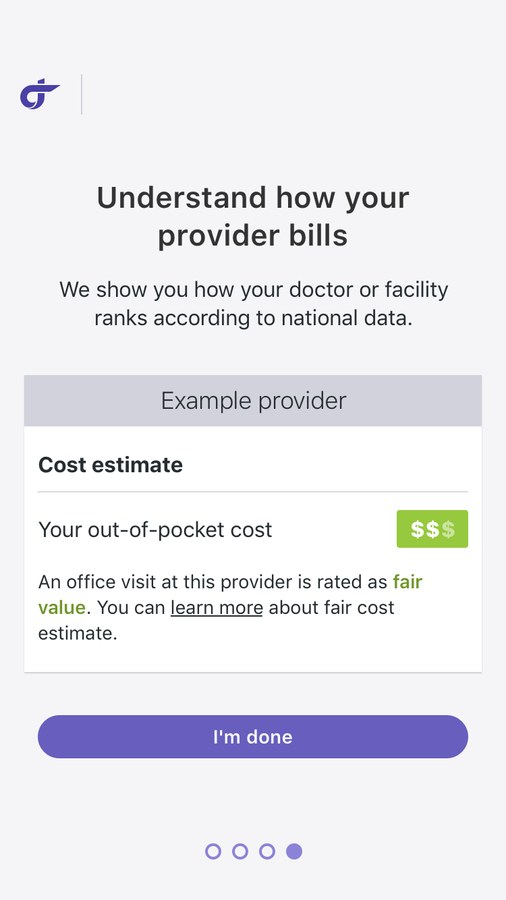
Service pricing indication, a new registration flow piloted for six weeks, and homepage suggestion cards tested in an A/B test.

Sales
Customizable demos

After we unveiled the vision at the HLTH conference, the final prototype became four end-to-end demos that generated $58M in sales pipeline.

Explore the mobile onboarding research

Mobile onboarding research

Onboarding had to explain its value

I led the member experience direction and research agenda. The team tested mobile onboarding prototypes to learn how much to explain, what to ask, and when to ask it.

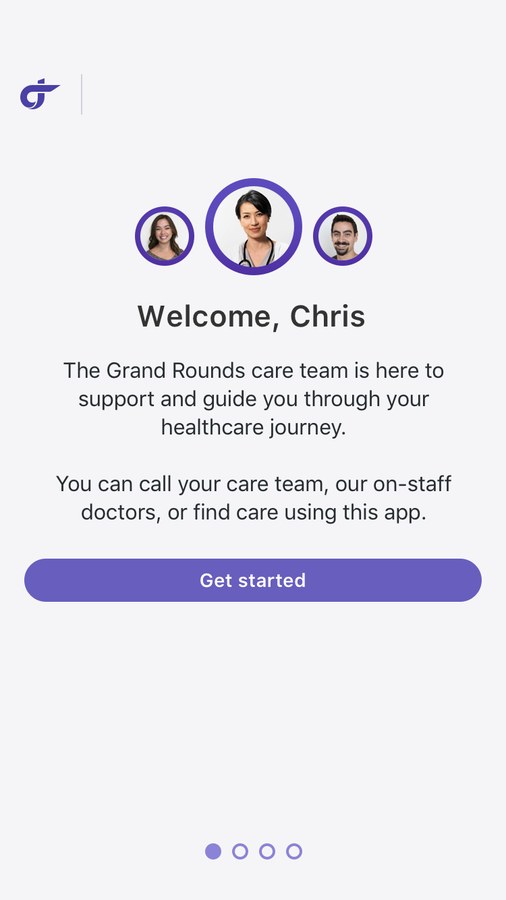
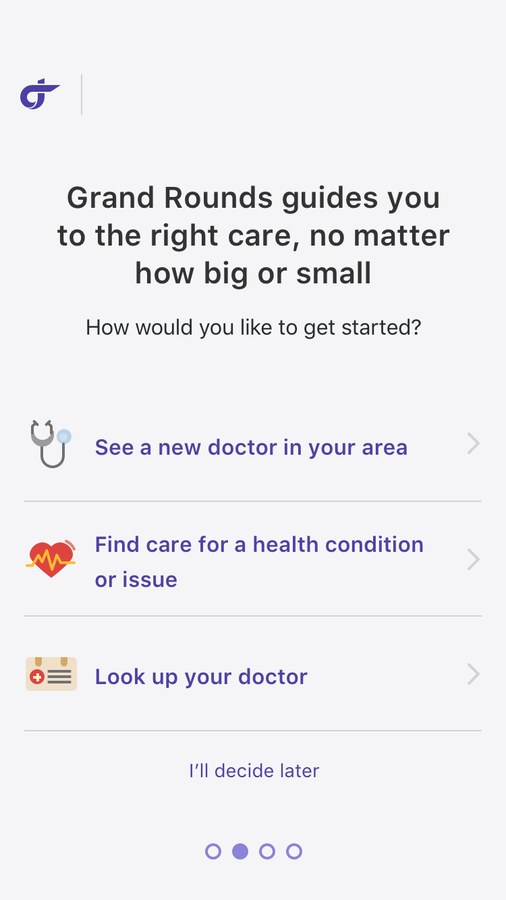
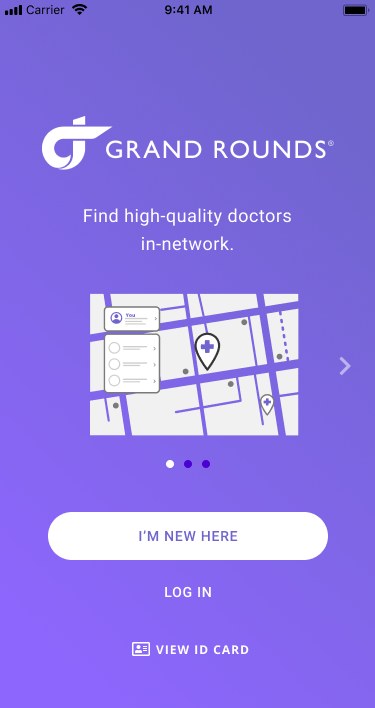
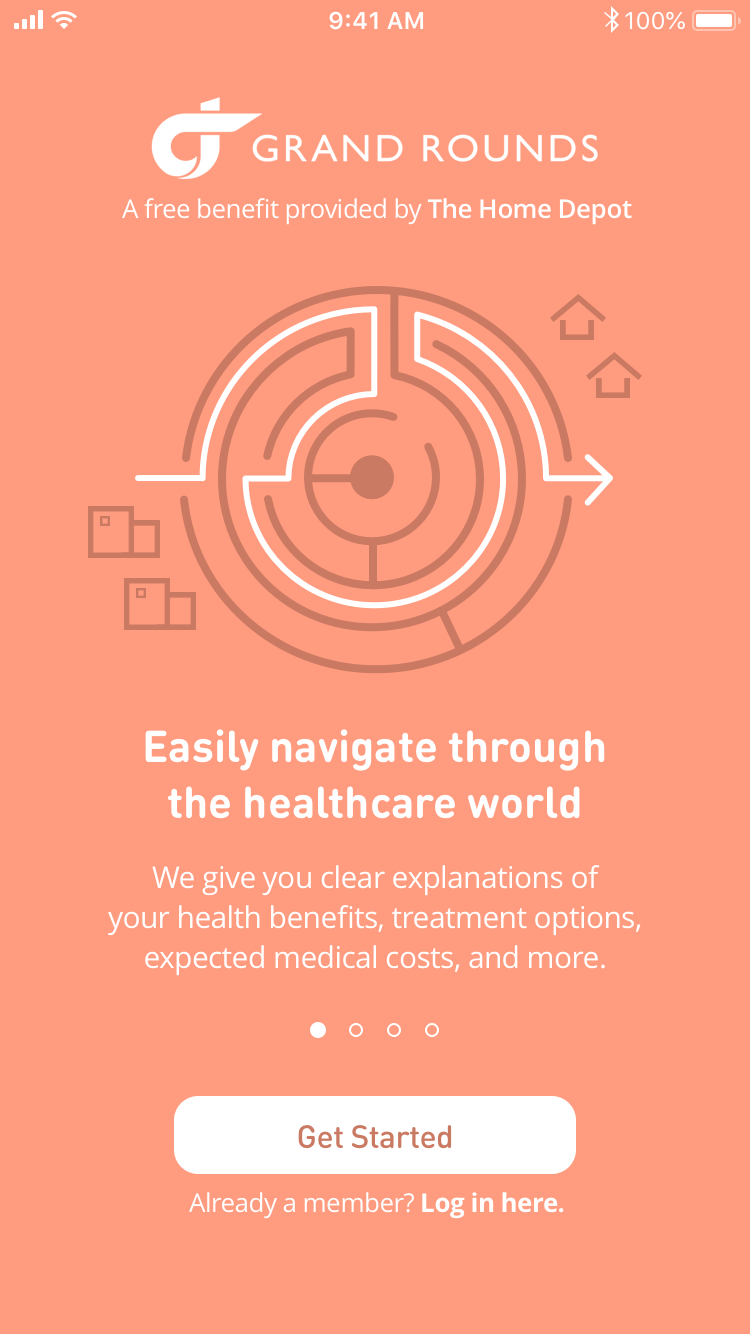
Original Grand Rounds mobile onboarding carousel prototype: benefit explanation, four page dots, and a Get Started button
Mobile research prototype, 2018. None of the six research participants clicked through the informational carousel.

Explain value in context

What we learned

Participants skipped the introductory carousel. They wanted to explore the service before committing to an account.

Design implication

Make the benefit clear where a member needs it. Let the experience demonstrate what the service can do.
Make each question earn its place

What we learned

People would answer questions when they understood how the information would be used.

Design implication

Explain the purpose of a question and connect the answer to more relevant guidance.

Set expectations we can meet

What we learned

Life-event questions helped people understand where Grand Rounds could help. Mental-health questions implied a service we could not yet offer.

Design implication

Ask about needs the service can support. What we ask tells members what to expect.

Grand Rounds design sprints, 2018. These findings came from a six-person study of mobile onboarding prototypes. The web onboarding pilot below was a separate design and evaluation.

What shipped

A guided web onboarding pilot

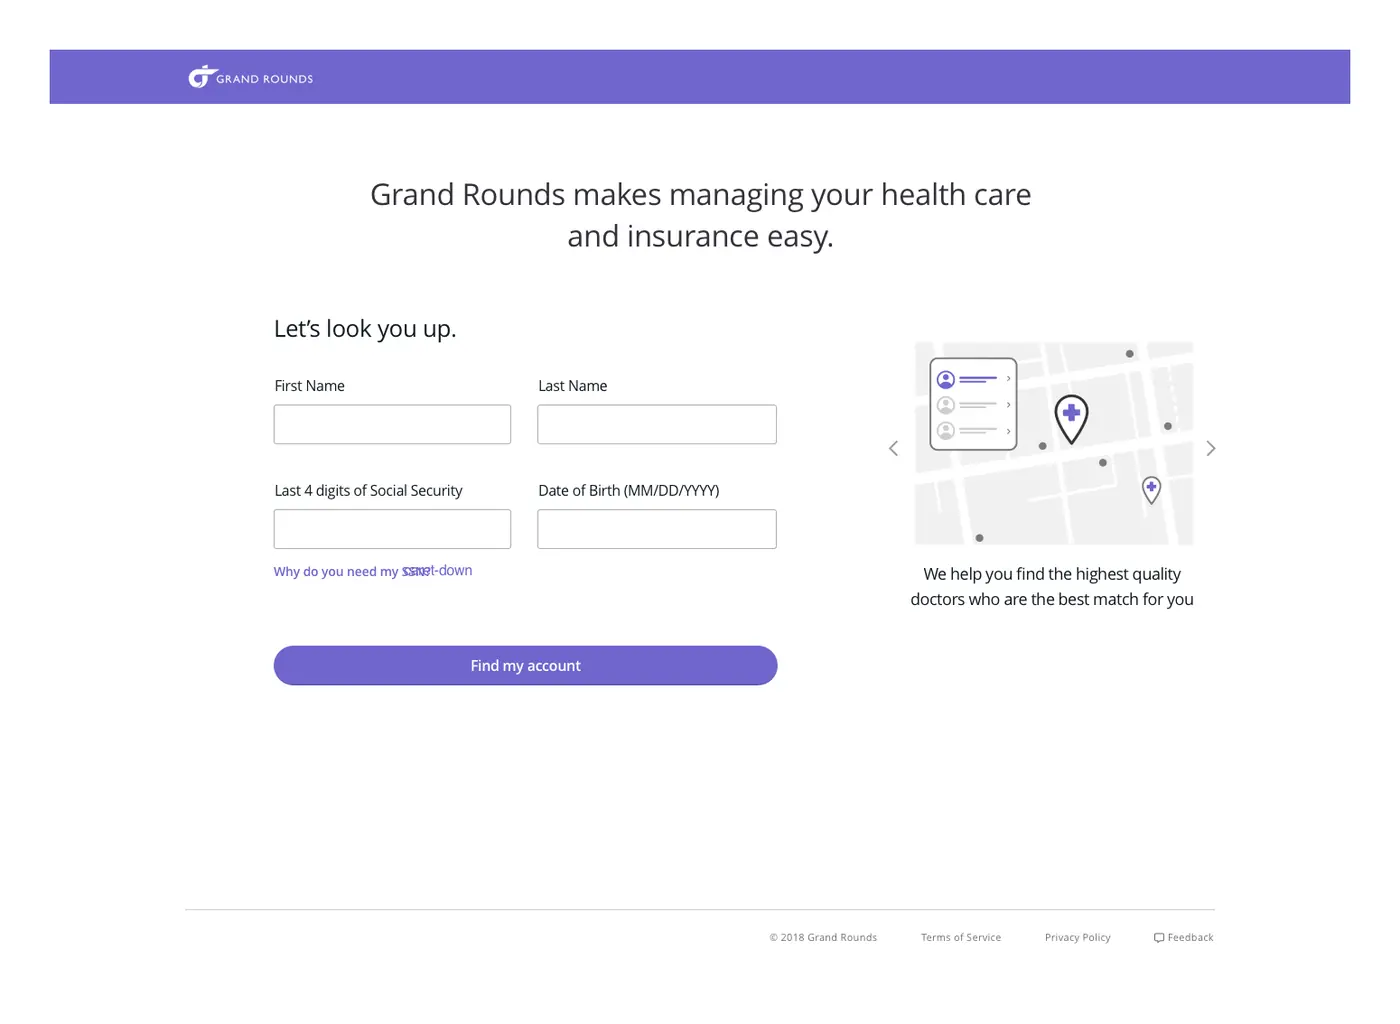
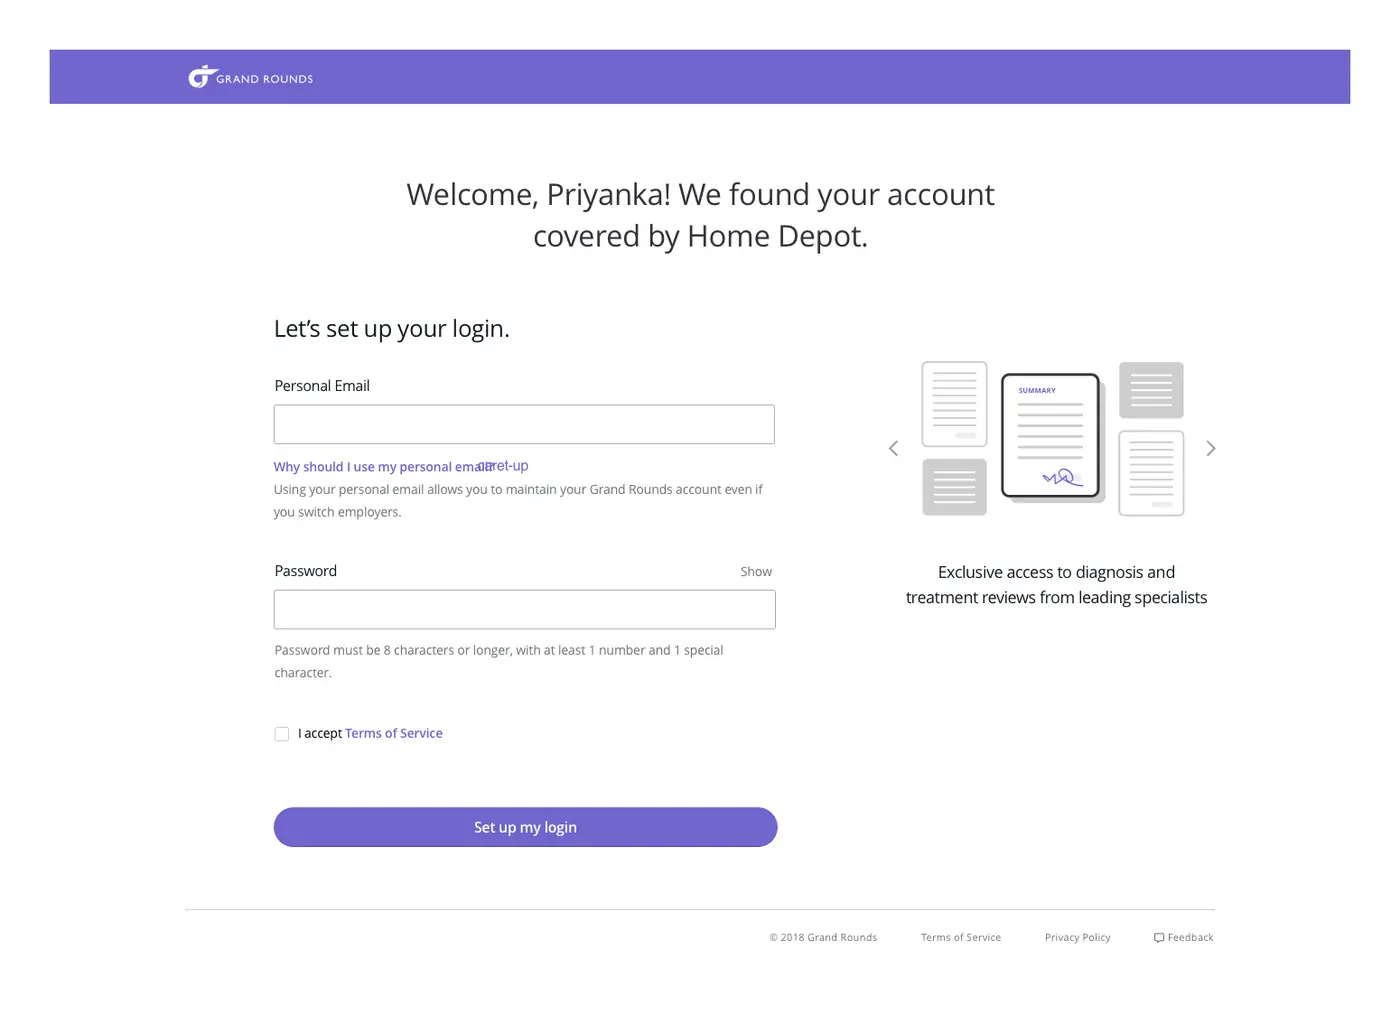
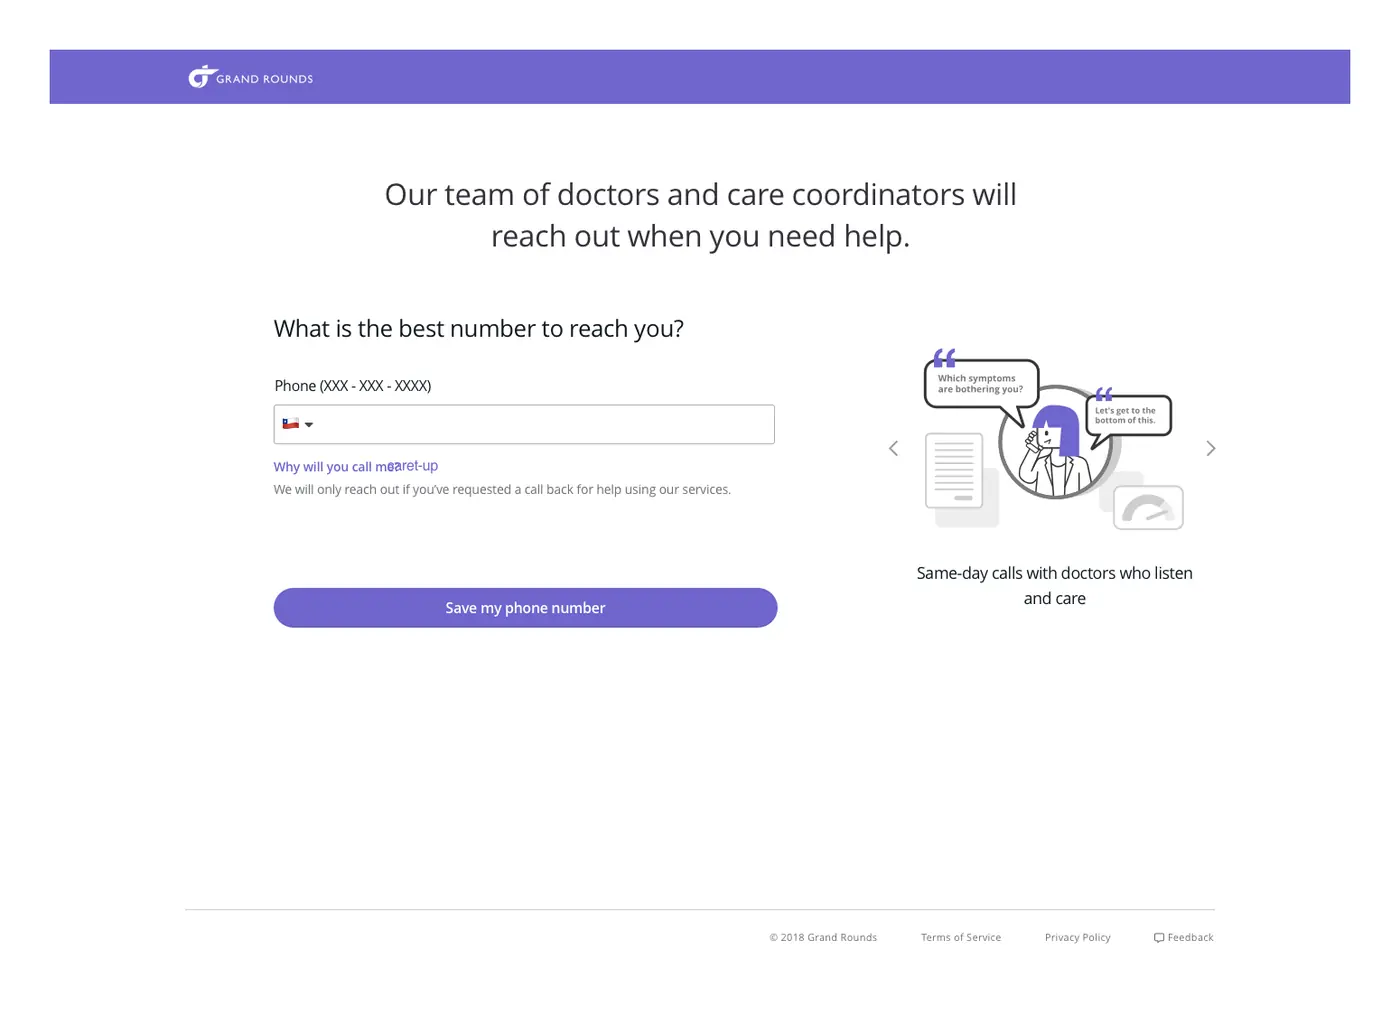
The web pilot introduced the service, showed members why they could trust it, and guided them to a first step.

Before

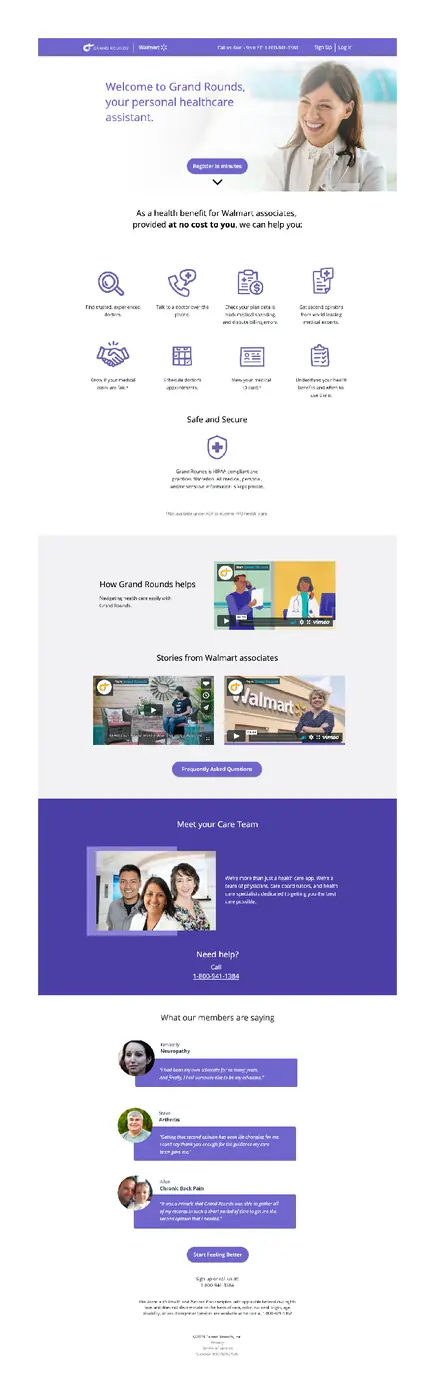
The original microsite on desktop and mobile

Activation sat below 50%, and a confusing microsite hid the benefit.

Web pilot

The guided pilot microsite, which introduces the service and establishes credibility
Guided onboarding, step one
Guided onboarding, step two
Guided onboarding, step three

Results

Production results: more sign-ups, service starts, and Care Team conversations

+15%
sign-up conversion
Registration flow, six-week pilot
+51%
new service starts
Registration flow, six-week pilot
+81.7%
Care Team conversations
Homepage suggestion cards, A/B test
Explore the research and supporting work

Behind the work

The research and hypotheses behind the vision

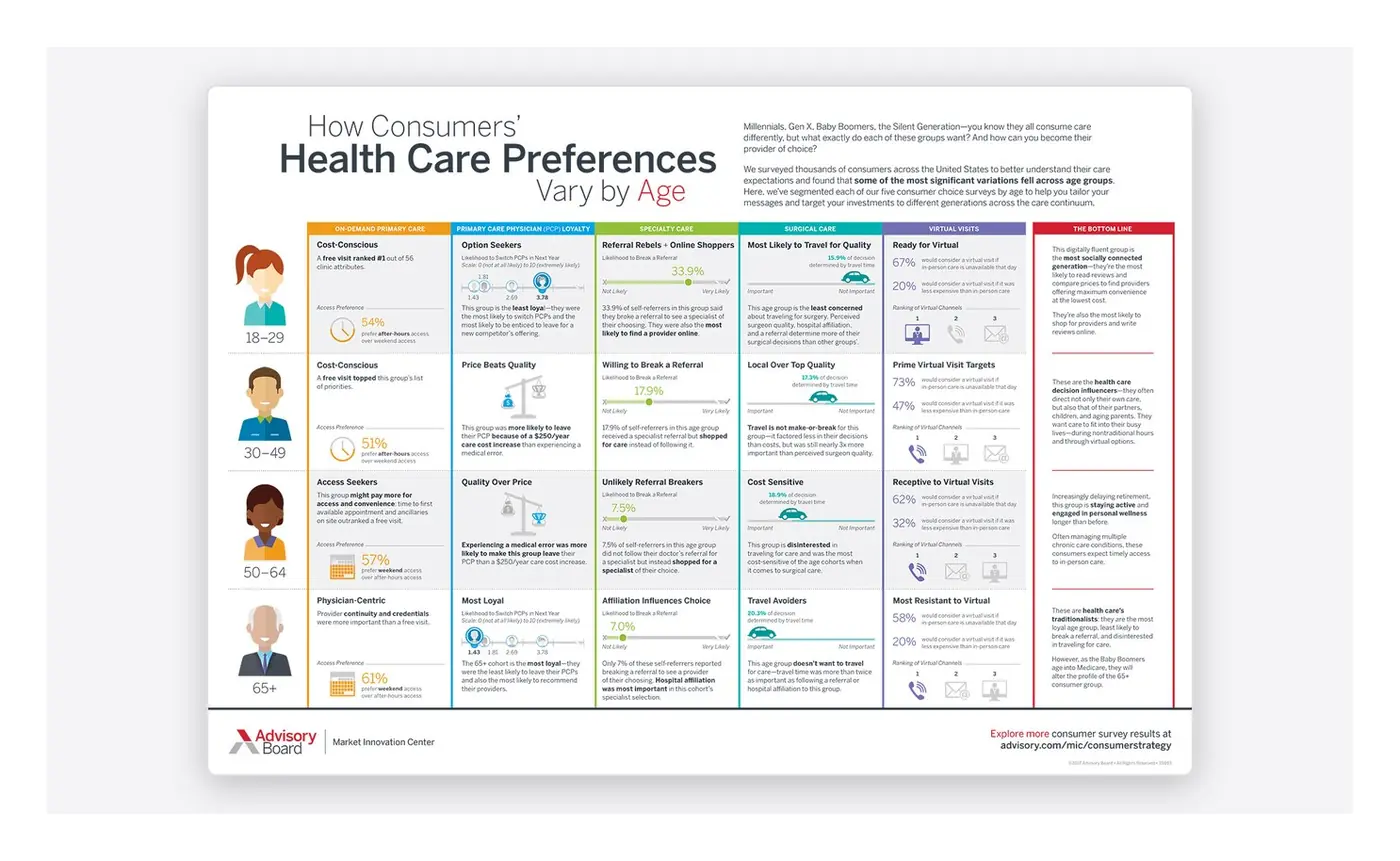
How consumer health care preferences vary by age, from the research inputs
The persona summary behind the service vision

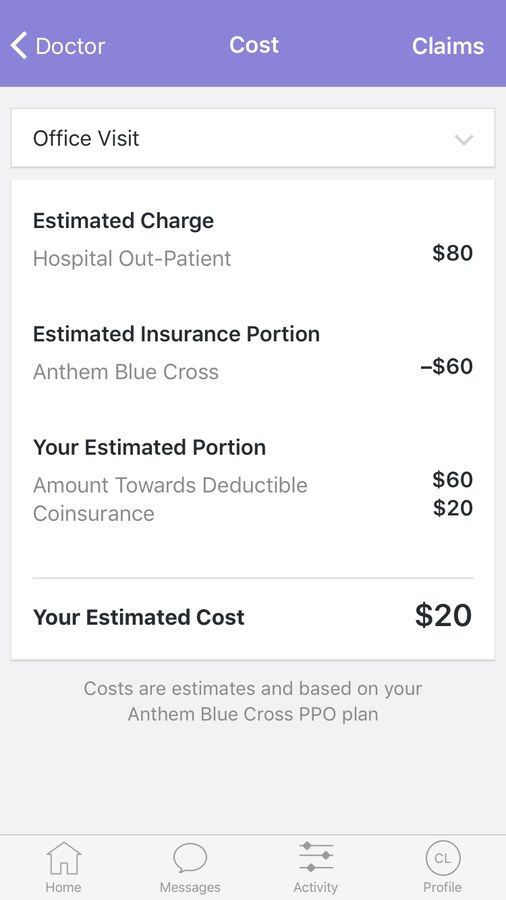
In research, a simple price signal raised intent to book

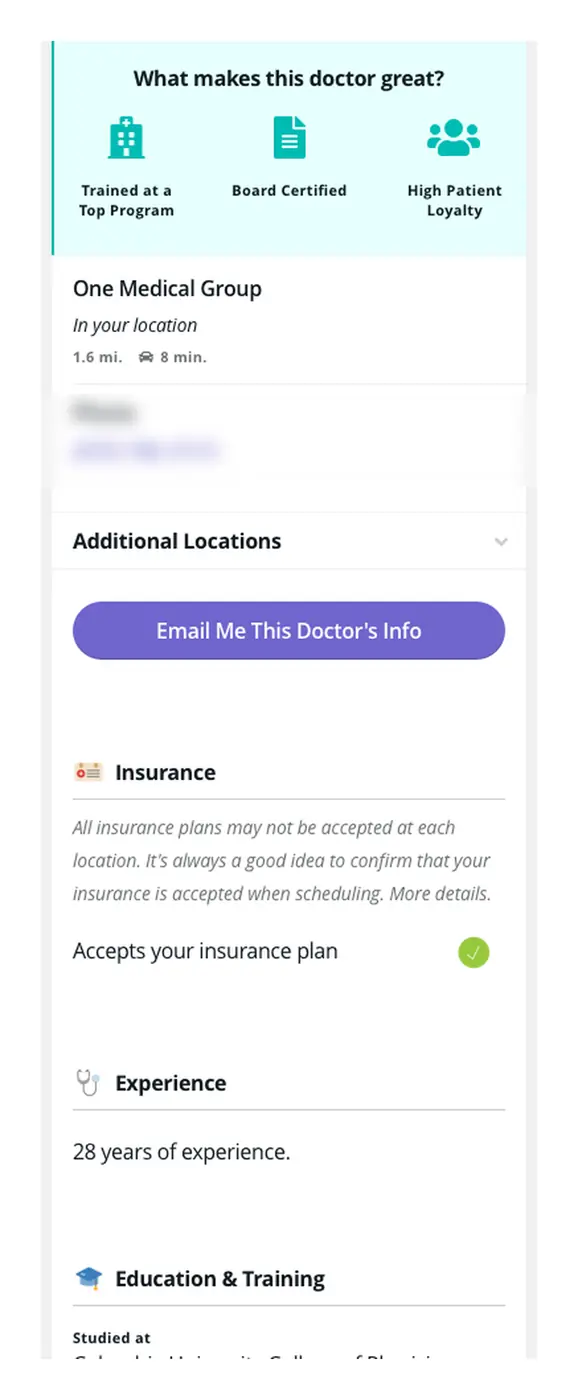
Control

Price test: the control screen

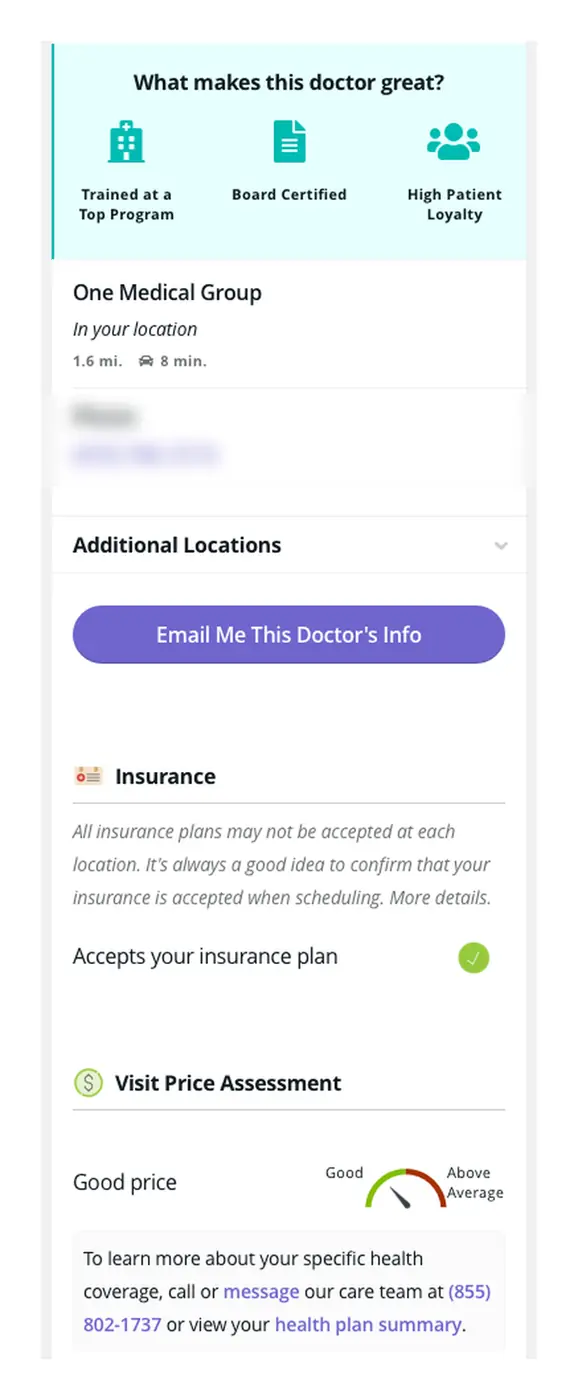
Barometer

Price test: the barometer screen

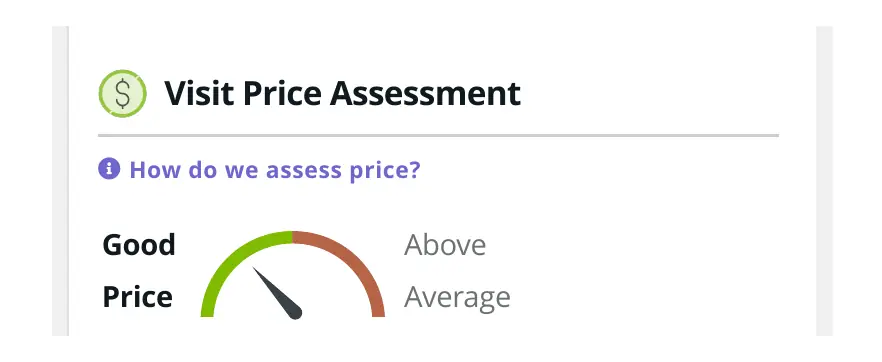
Detail

Detail of the good price barometer
78% → 83.2%
said they would book when shown a “good price” signal
Stated booking intent; statistically significant

The problem

Only 59.8% of 1,071 people surveyed could define a deductible.

The decision

Proceed with the barometer. Dollar-sign treatments raised stated intent for both good and above-average prices. The barometer raised intent for good-value care and lowered it for above-average prices. Service pricing indication went to production.

The price study tested 12 treatments with 3,600 participants overall. The good-price comparison used 667 control responses and 274 barometer responses. This measured hypothetical booking intent. The separate insurance-comprehension survey included 1,071 respondents.

Personalized prompts connected members to useful help

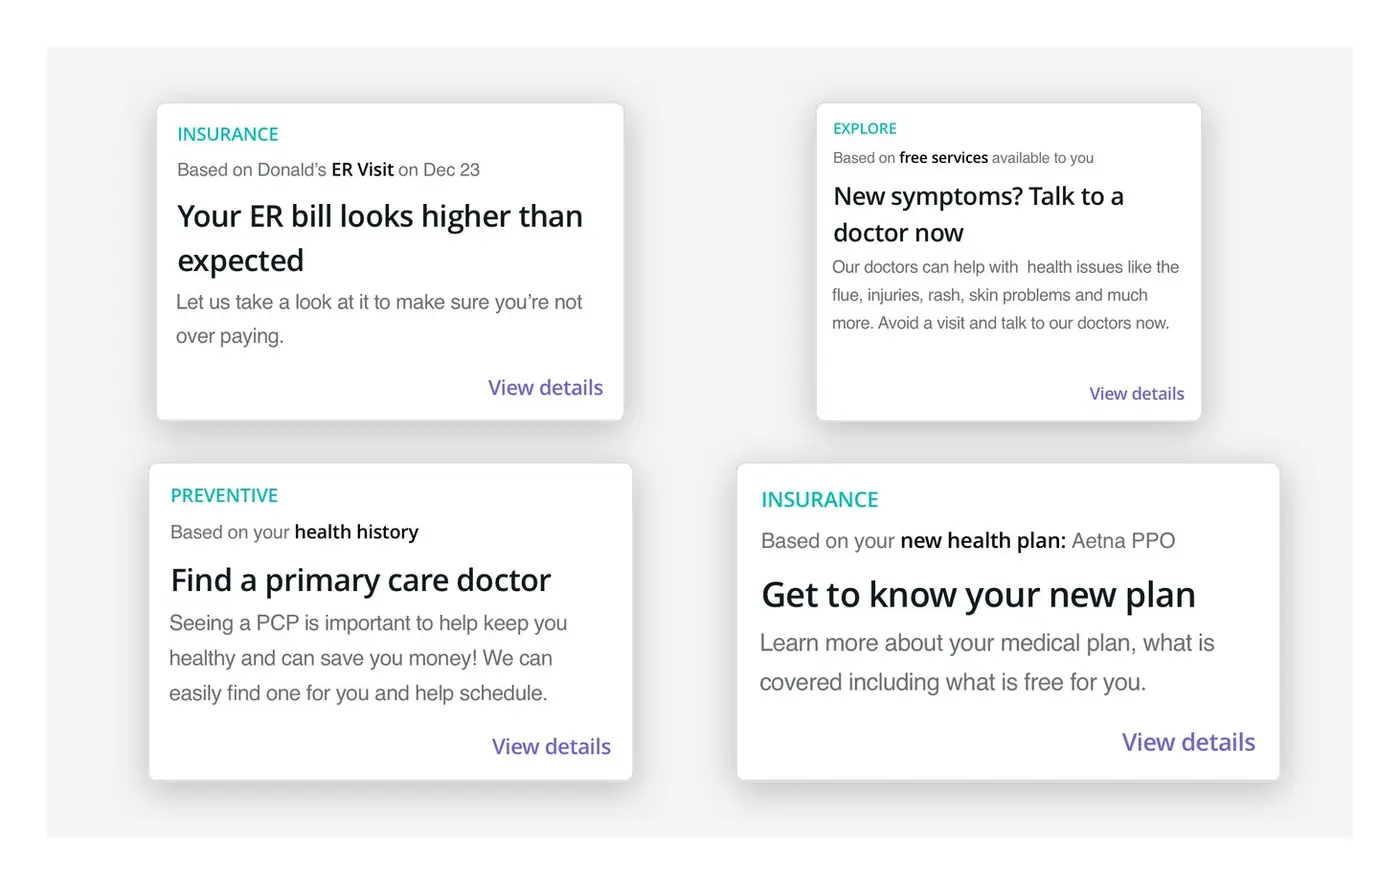
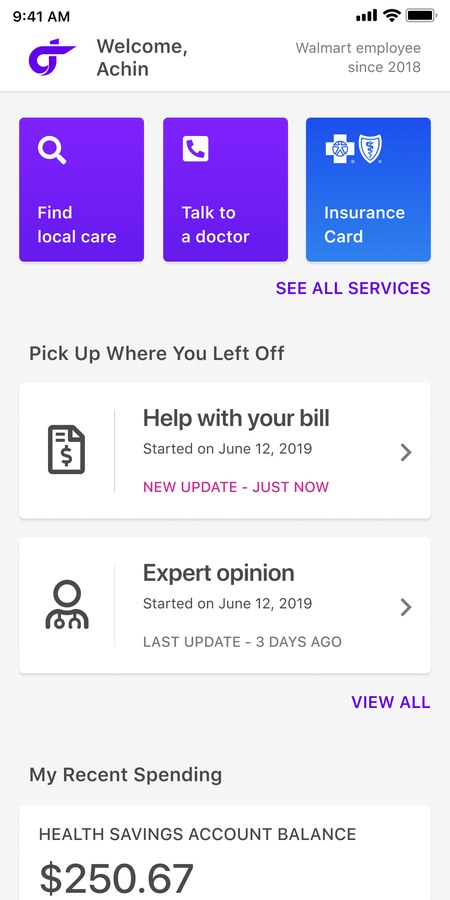
Personalized prompts on the member home screen
Prompt cards for financial guidance and care navigation

A next step tied to the member’s situation

Financial guidance and care navigation became visible actions on the homepage.

Tested in an A/B test; the result is with the production results above.

Sales enablement: the prototype became a customizable demo

One of four end-to-end demos of the service vision
$58M
sales pipeline generated
Pipeline value
22
sales consultants and PMs trained
4
end-to-end demos

We turned the final prototype into customizable sales demos so prospective customers and delivery teams could see the future platform. The demos generated $58M in sales pipeline.

See the design sprint gallery

The team

The Grand Rounds product design and research team

Designers and researchers from the 17-person organization I led. They ran the Design Sprints with product, engineering, clinical, and analytics partners, and designed the prototypes and the web onboarding pilot. The results on this page are theirs as much as mine.

  • Brad
  • Helen
  • Japeth
  • Joyce
  • Matt
  • Meg
  • Miley
  • Nadyne
  • Nicholas
  • Nicole
  • Priyanka
  • Tony
  • Vanessa